An interactive dashboard that provides opportunity to easily identify new leads

Their Challenge
The former version of the EXTRA app featured options to consult a database of uninsured companies by applying different filters to identify them as leads. However, it lacked clear visibility and visuals to easily use the system, it lacked several features for further interaction and it lacked options to effectively work on selections and leads. This made it difficult to identify and pursue new business opportunities effectively. To address this, new features, such as data visualisations, were identified to enhance the ability to identify entities that could be targeted as leads.

Our solution
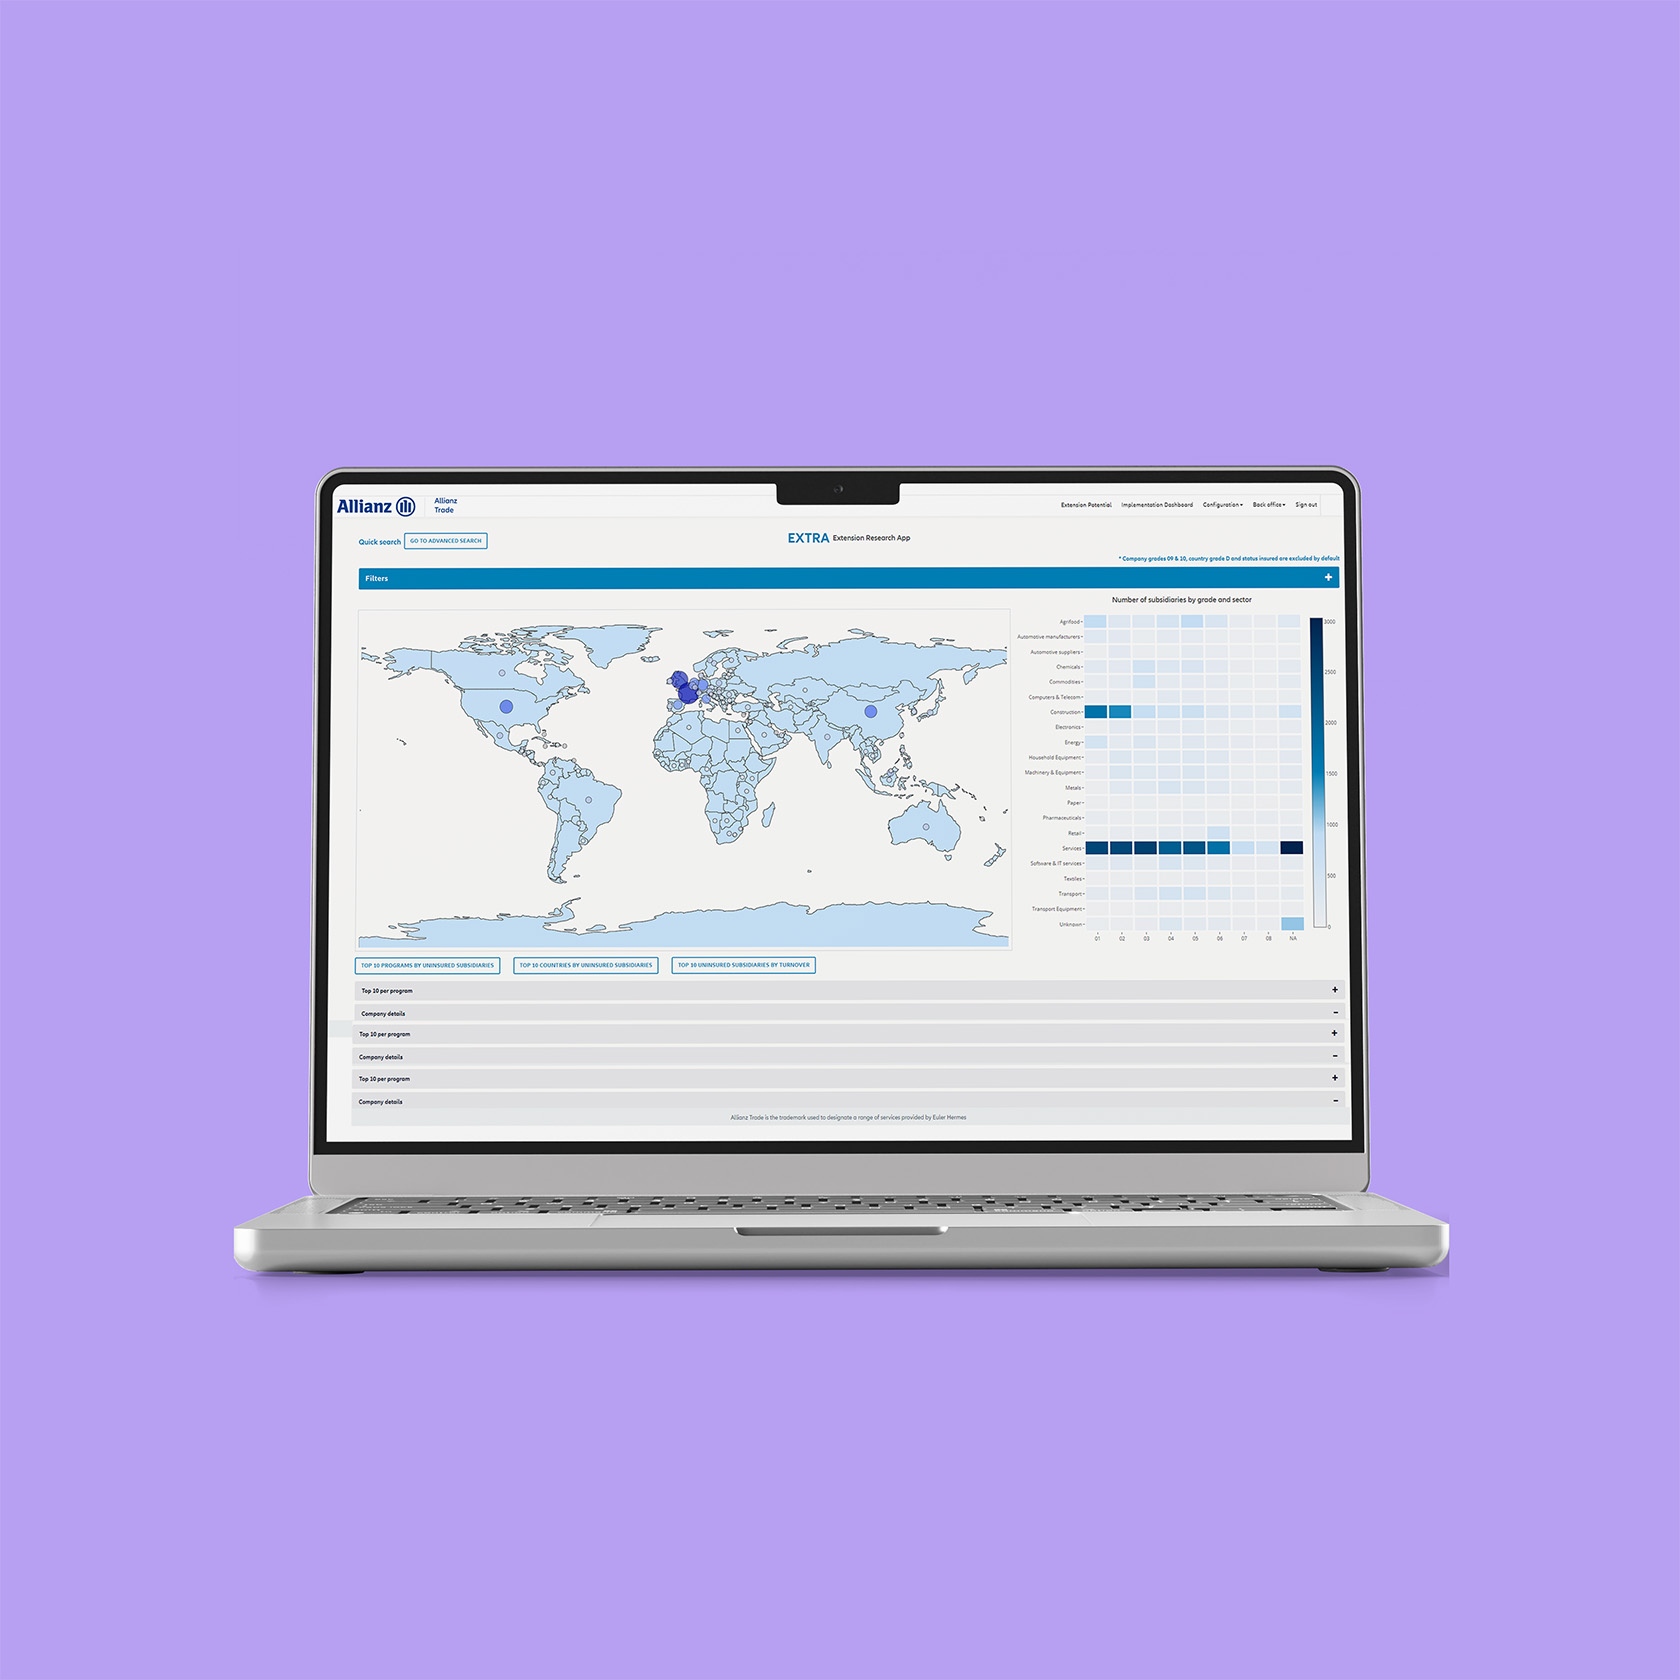
Together with Allianz Trade an interactive dashboard, that consists both of a quick- and advanced search, has been created that provides clarity on which entities identify as a lead in which segments (e.g. geography). Users can easily apply one of many custom filters as well as pre-filtered buttons displaying a new overview based on the several different data points visualised on a world map a heat map and several data overviews. This new dashboard enables users to access tailored information as required and explore data across various regions and metrics.
Delivering the dashboard was a great opportunity to optimize the user experience for existing dashboard features and set a basis for delivering new functionalities in the future.
Features
Quick search with data visualisation
A dynamic and interactive world map and heat map, featuring pre-filtered buttons for quick access to key data. The dashboard also includes additional functionality that allows for custom filtering and sorting based on user preference.
Advanced search
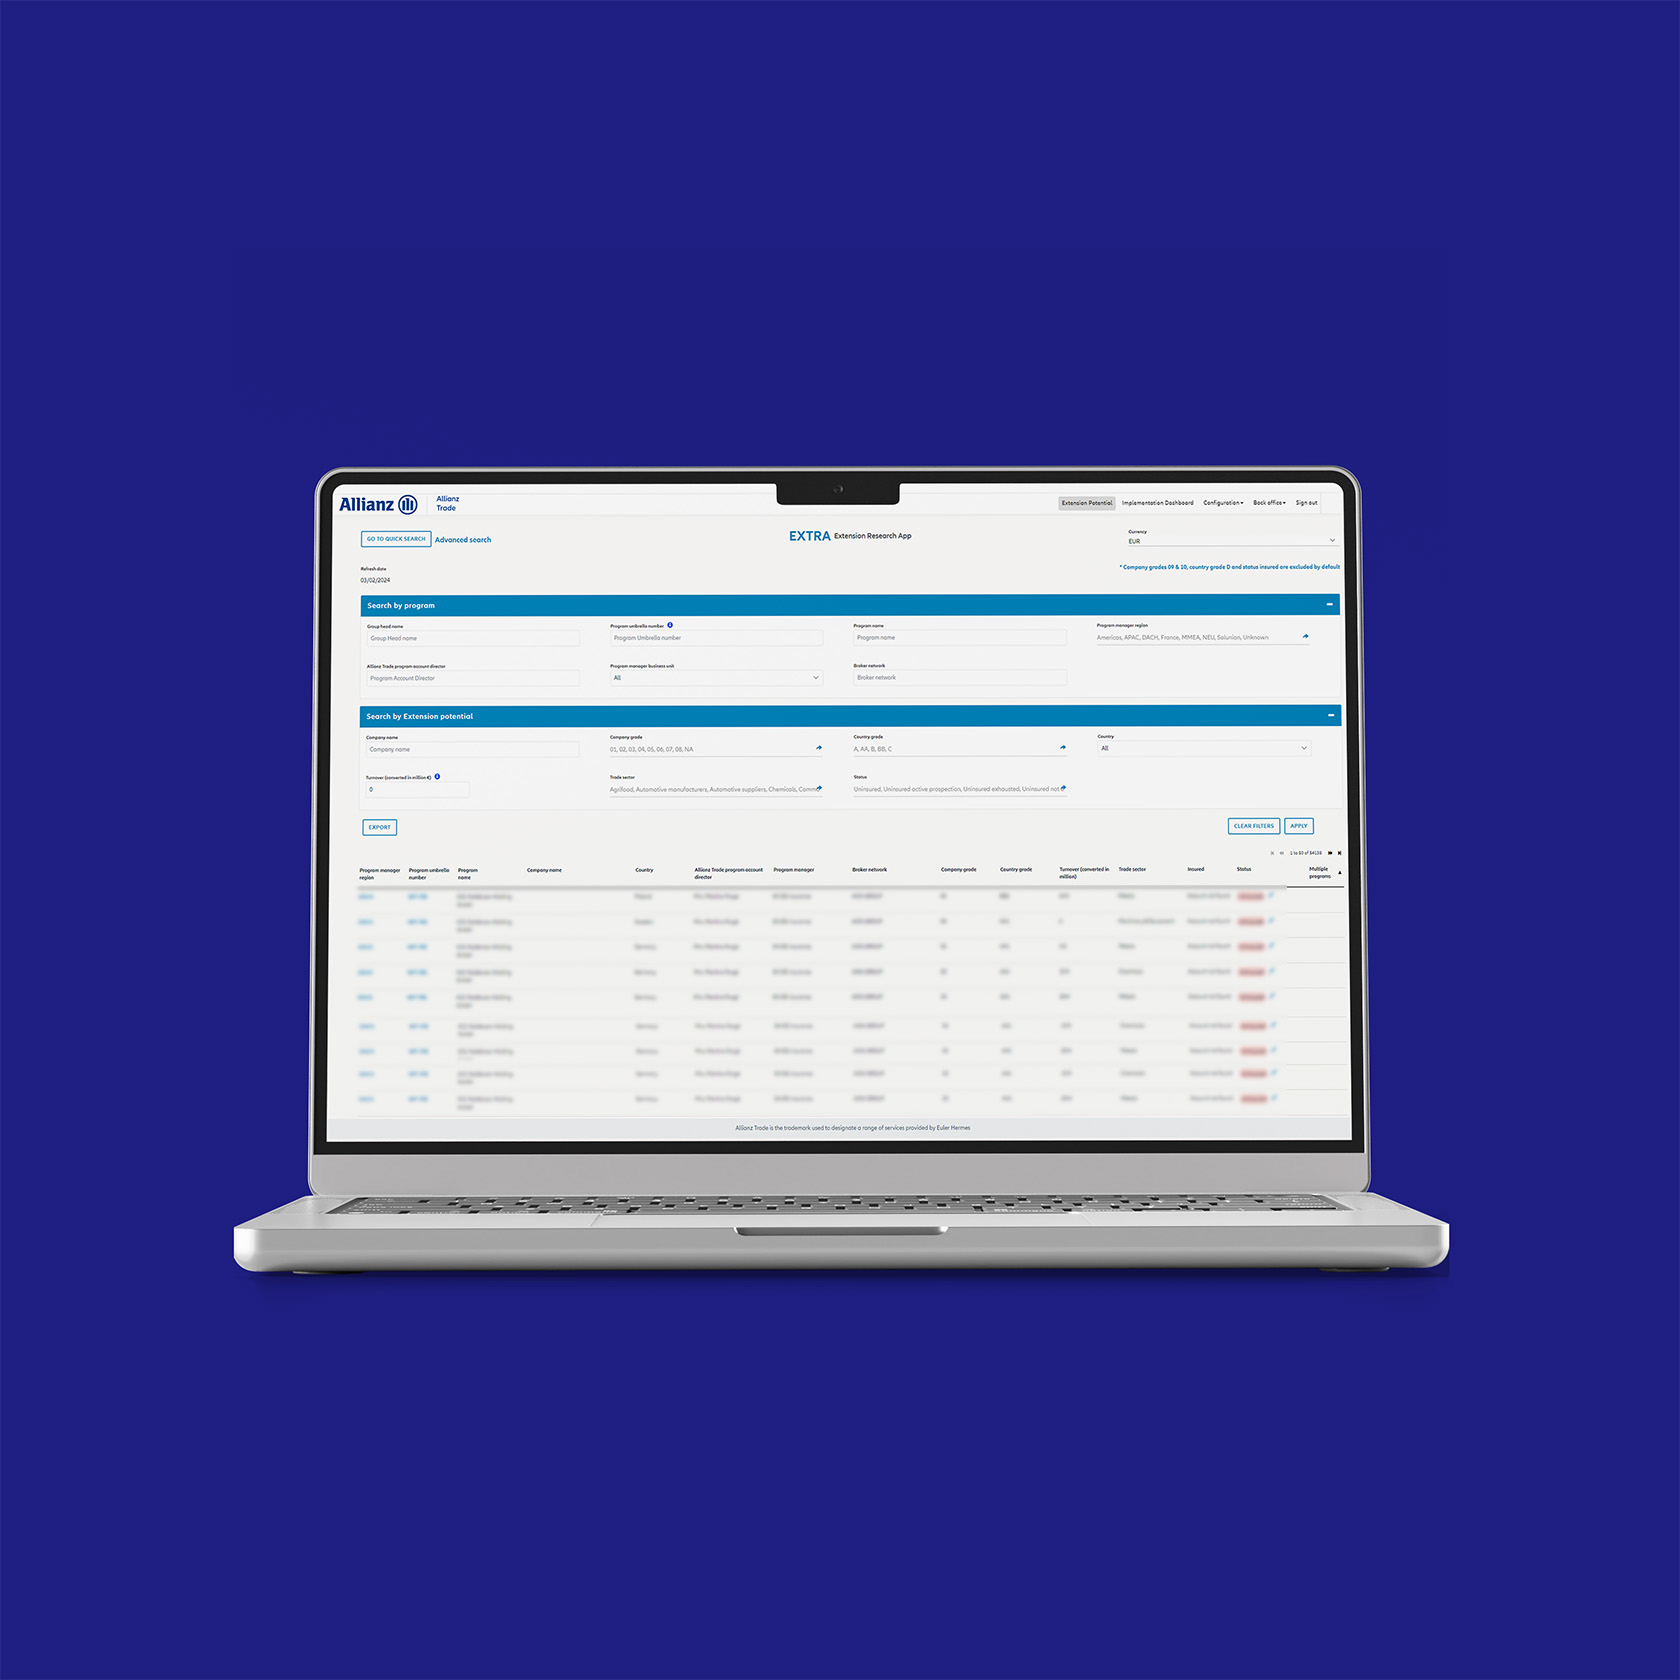
A comprehensive overview screen that presents all relevant data in a user-friendly interface, offering robust options for custom filtering and sorting.
More interactivity
An enhanced possibility to mark leads, add comments, interact with other users and apply some CRM like functions on the selected leads.
User profile and data split
Users have personal accounts where only data connected to their network is displayed and visualised.

Result
An interactive dashboard that enhances the opportunity, through data visualisation and opportunities for a wide range of filtering, to identify new leads that can be approached as leads potential.
Industry
Financial Services
Technology
Mendix
Solution
Digital Innovation


