

Data analytics in financial services scale-ups | A look behind the scenes
Data -and analytics- should be utilized as the driving force behind decision-making for companies in the financial sector, especially in scale-ups. Since most scale-ups in the financial sector have a limited budget, yet want to grow rapidly, data is of utmost importance. Data analytics is a valuable source of information because these analyses can be used to realize growth and gain a competitive advantage.
We always tell our customers the advantages of using data and a data-driven organisation, we explain to them how to extract useful information from their data and how they can optimize their processes using data. To give you an inspiring example, we would like to share our story of how Finaps uses data effectively to make better-informed decisions.
In short:

1. Back to the start
Goal first thinking.

2. Working on a solution
The approach to develop this data-driven solution van be summarised in 7 steps.

3. final remarks
Being data-driven is a spectrum, it is not binary & how can we help you?
1. Back to the start
Goal first thinking
We were determined to be a data-driven organisation, but we –as most companies– faced some challenges along the way. What has always helped us forward was our “goal-first mindset”: what are our goals and how can data be leveraged such that it helps us achieve these goals? By adopting this mindset, you make sure that you are using data to make better-informed decisions, rather than “using data” being a goal on itself.
With this goal-first mindset, we summarized our objectives into three main goals: happy employees, happy clients, and commercial growth. Once these goals were determined and understood by everyone, we determined the Key Performance Indicators (KPIs), which can be measured to achieve these goals.
“What are our goals and how can data be leveraged such that it helps us achieve these goals?”
2. Working on a solution
Solution
When developing a solution, we have this mindset that it should be ‘simple and effective’. Therefore, as an initial setup, we have decided to develop a dashboard that visualizes an analysis of the available quantitative data regarding hour registration. Since we are a company that is working for clients on a project-based level, we determined that most of the information is within our hour registration.
The approach to develop this data-driven solution can be summarized in 7 steps:
1. Formulate a concrete problem to be solved
2. Determine KPIs to measure the effectivity of the solution
3. Collect all relevant data
4. Prepare all data such that it is suitable for analysis
5. Transform data into information (and KPIs)
6. Visualize the correct information
7. Evaluate the delivered solution
Although these steps logically follow each other linearly, the project itself is not always linear in fashion. This is because it is impossible to know how much value the visualisations add without building them first. It might be that while building the visualisations, it is concluded that extra data is necessary and new data needs to be collected, thus going “back” in this 7-step process.
Going back and forth between the different steps, improving the dashboard with each iteration, a valuable dashboard has been created. Do you want to see a dashboard in action? Contact one of our experts!
“Although these steps logically follow each other linearly, the project itself is not always linear in fashion.”

3. Final remarks
Being data-driven is a spectrum, it is not binary. You can always become a more data-driven organisation – and so do we. This story is just one of many possible examples on how to embed a data-driven culture within the organisation. As a final remark, we must mention that the most important aspect to become more data driven is the organisational culture: in a data-driven organisation, the culture should be one of continuous improvement.
If you want to know whether your organisation has the culture to become data-driven and/or what kind of culture is necessary to become data-driven, you can read the following blog: Is your organisation truly data-driven?.

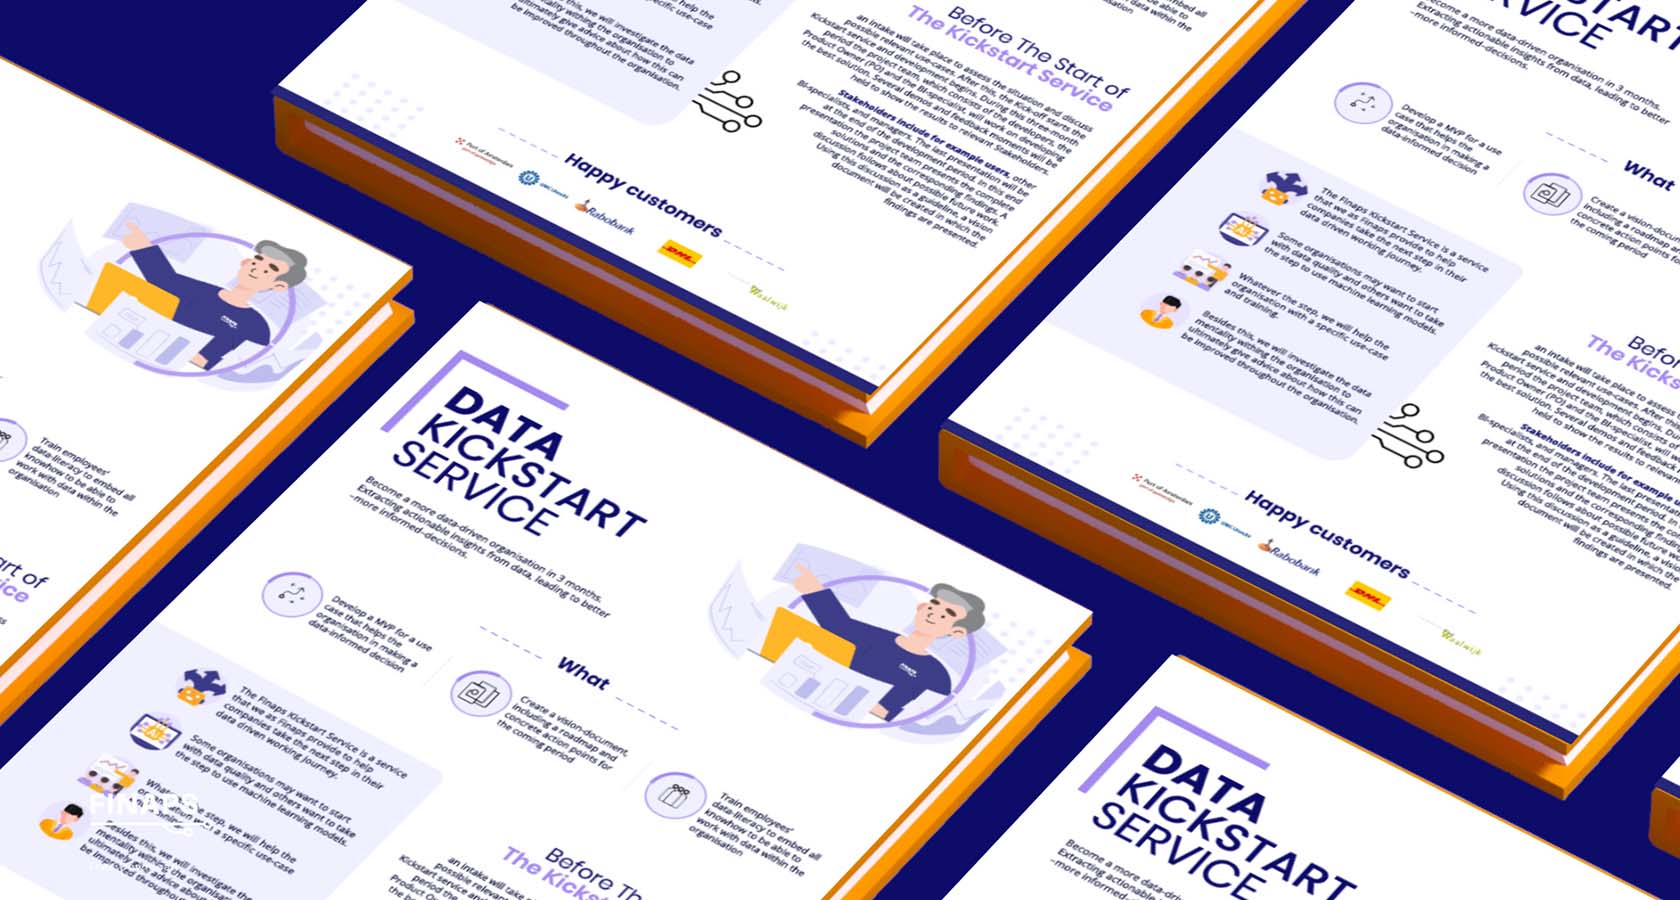
Getting started with the data kickstart service
1. Develop an MVP for a use case that helps the organisation in making a data-informed decision
2. Create a vision-document, including a roadmap and concrete action points for the coming period
3. Train employees’ data-literacy to embed all knowhow to be able to work with data within the organisation
Our cases


Our tech partners
Finaps uses fit-for-purpose (FFP) technologies, either Open Source or licensed. Mendix is our strong low-code platform partner, while we use SAS for its outstanding analytics platform. Our advice doesn’t depend on the available framework but is always based on the best possible solution for our client. As it should be.